
Tanner Reese checks in with his thoughts on Sam Reinhart's impact on the Sabres...
***
The Buffalo Sabres drafted Jack Eichel in 2015 with much fanfare. The previous season saw the team being outplayed on the ice by a wider margin than any team in the Corsi Era, and the organizational transition that General Manager Tim Murray initiated was progressing from teardown to rebuild. Jack Eichel was The Franchise for Buffalo now, right? He’s the cornerstone that the team will build around for the foreseeable future.
Well, hold on a minute. In 2014, in a draft class with no clear consensus on who the top prospect was, the Sabres selected Samson Reinhart. In his 9 game stint the following October, it was clear that he required a bit of development to live up to his draft status.
Now 100+ games into his career, let’s see how he’s faring.
Reinhart was drafted with the understanding that he was never going to blow you away with his raw athleticism or his power or anything of that nature. He was billed as a player who thinks the game at a level higher than most and would impact the game in subtle ways. Let’s first look at the not-so-subtle ways that he’s made a difference.
Reinhart has the second most Primary Points per 60 minutes (P1/60) on the Sabres as of this writing with 2.0, a categorization of production that discards secondary assists. Now, you may be thinking of plenty of plays where the player who gets the secondary assists on a goal (or even no assist at all) made the key move that lead to the goal. I get it, they can be important! Yet, secondary assists have shown to be less predictive of future assists because they’re another degree removed from your contribution. Here’s a link if you care, written by a man who was later hired by the Carolina Hurricanes.
Think of it this way: a goal that you score is solely dependent on your goalscoring talent. You’re the main influence on that outcome. A primary assist is another degree of influence removed; the result is dependent on your ability to pass the puck and your teammates ability to score. A secondary assist is another degree of separation, where the outcome is dependent on your passing ability, then the passing ability of your teammate, and then the goalscoring ability of a third teammate. Primary points are just more indicative of point-producing ability. If you don’t agree, please continue to read my article anyway because I am still your friend.
Okay, so back to the statistics. Samson Reinhart also has the highest rate of expected goals on the team. Expected goals, or xG, are a way to evaluate shots based on their danger. Not all shots are created equal. Based on historical shooting percentage from various areas, Emmanuel Perry of Corsica created a model to figure out how many goals a team deserves to score. So, if you take 10 shots that are each expected to go in about 10% of the time, you’re expected to score 1 goal. Seems simple. When Reinhart is on the ice, the Sabres are expected to score 55% of the goals (via Corsica.hockey). This doesn’t mean they always will, as variance in shooting percentage and bad bounces and the like take away goals for our team and give other teams goals all of the time. Yet, the results are more likely to be in the Sabres’ favor with Reinhart on the ice. His expected goals for % is 7.98% higher relative to his teammates. The percentage of shots that the Sabres control with Reinhart on the ice is 3.31% higher than their percentage with him off of the ice, another sign that he’s a contributor for this team.
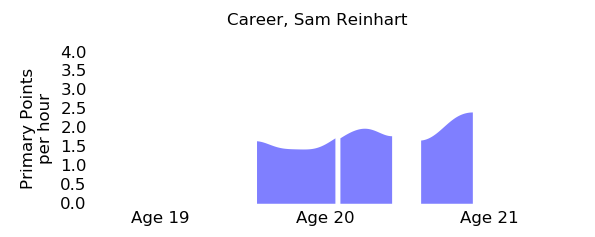
Here’s the rolling average of Reinhart’s P1/60 throughout his career via hockeyviz.com: I remember thinking for a moment (okay, maybe a few moments) that Reinhart was off to a poor start this year. Well, I was wrong and you were wrong if you thought that with me. But that’s fine; he’s producing better than ever and showing clear signs of real development. So, that’s great. Beyond the Corsi, though, let’s look at how his much-hyped defensive acumen is actually paying off with results on the ice.
I’m going to show you a variety of heat maps displaying shot locations from Micah McCurdy on hockeyviz.com. Red means above league average, and blue means below league average. The redder the color, the greater degree above league average, and the same is true as for the blue. Think red=hot, blue=cold in terms of shots.
Okay, so back to the statistics. Samson Reinhart also has the highest rate of expected goals on the team. Expected goals, or xG, are a way to evaluate shots based on their danger. Not all shots are created equal. Based on historical shooting percentage from various areas, Emmanuel Perry of Corsica created a model to figure out how many goals a team deserves to score. So, if you take 10 shots that are each expected to go in about 10% of the time, you’re expected to score 1 goal. Seems simple. When Reinhart is on the ice, the Sabres are expected to score 55% of the goals (via Corsica.hockey). This doesn’t mean they always will, as variance in shooting percentage and bad bounces and the like take away goals for our team and give other teams goals all of the time. Yet, the results are more likely to be in the Sabres’ favor with Reinhart on the ice. His expected goals for % is 7.98% higher relative to his teammates. The percentage of shots that the Sabres control with Reinhart on the ice is 3.31% higher than their percentage with him off of the ice, another sign that he’s a contributor for this team.
Here’s the rolling average of Reinhart’s P1/60 throughout his career via hockeyviz.com: I remember thinking for a moment (okay, maybe a few moments) that Reinhart was off to a poor start this year. Well, I was wrong and you were wrong if you thought that with me. But that’s fine; he’s producing better than ever and showing clear signs of real development. So, that’s great. Beyond the Corsi, though, let’s look at how his much-hyped defensive acumen is actually paying off with results on the ice.
I’m going to show you a variety of heat maps displaying shot locations from Micah McCurdy on hockeyviz.com. Red means above league average, and blue means below league average. The redder the color, the greater degree above league average, and the same is true as for the blue. Think red=hot, blue=cold in terms of shots.
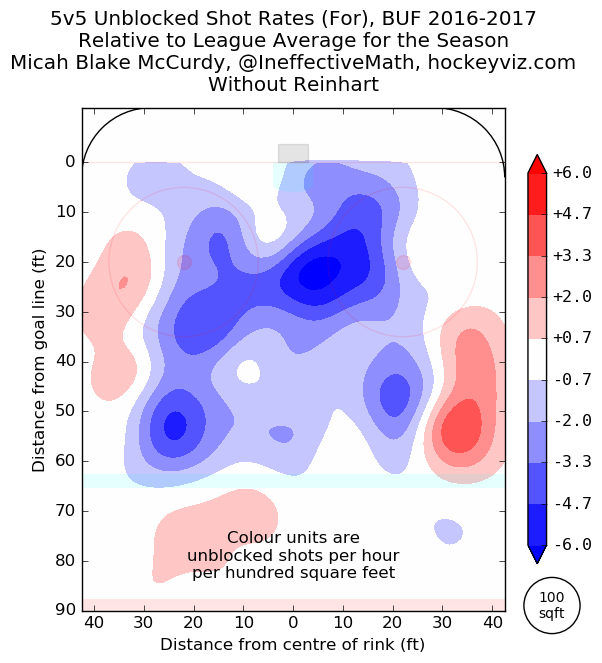
First, for reference, the 2016-17 Buffalo Sabres as a team:

The team allows a bunch of outside shots, and maybe a little too many from the high slot, but they command the crease and the circles very well.
Okay, so let’s break this down.
Okay, so let’s break this down.
With Reinhart on the ice, the Sabres still control the crease well. They’re better through the top of the circles, except for the high slot. Below the circles, the Sabres appear to defend better with Reinhart on the ice. The deep reds at the top of the zone are relevant, but not incredibly damning. Those shots are less dangerous than the ones that Reinhart appears to take away from opposing teams. It looks like Reinhart is probably close to net-neutral defensively, helping a bit in one area and giving up a bit in another.
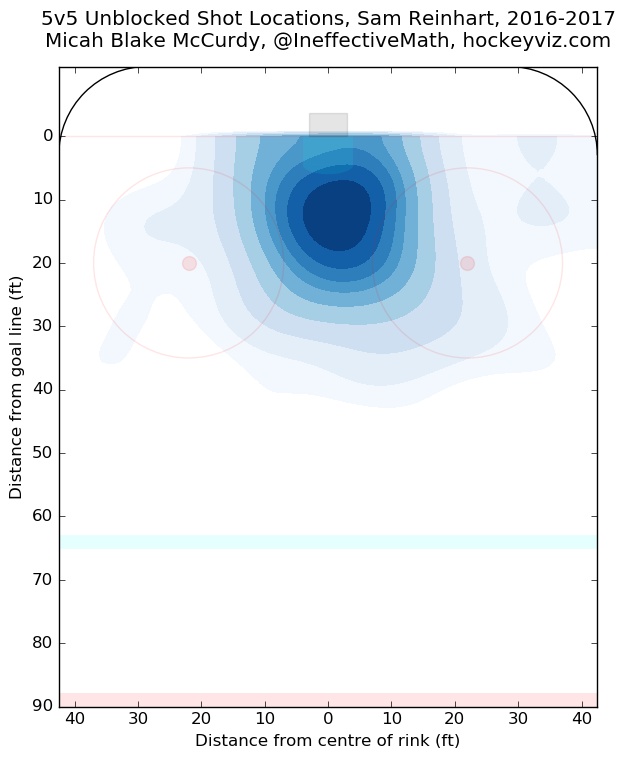
Let’s look at the offensive side now. We’ve seen that he’s producing the points, now let’s look at how likely it is that it’ll continue. First, his personal shot locations. It seems as though Samson is prone to taking shots from in tight—the locations where shots are the most valuable and most likely to be a goal. So he isn’t riding some crazy luck streak where a bunch of outside shots are pinging in off of defenders earlobes or something. He’s in the crease and the high slot and he’s firing them in the net. This seems pretty likely to be a sustainable method for scoring goals.
Now, how well does the team perform in the offensive zone with and without Reinhart?
Again, I’ll give you the Sabres team in general and then With and Without Reinhart. The color scheme is the same as before.
This shows that the Sabres aren’t an offensive juggernaut, which we all were quite aware of. They don’t shoot much from dangerous areas compared to league average.
Now, let’s look at With and Without Reinhart.

Uh, hey, that looks different. With Reinhart on the ice, the Sabres are a more dangerous offensive team. I mean, look at the “Without” chart. They don’t shoot from near the net more than an average team, or from basically anywhere. Without him, they’re incredibly inept offensively with regard to creating shots. With him, though, they’re better than average in a lot of places and in one location in particular: the net mouth. That’s a common theme with Reinhart’s game.


Defensively, he protects the area where the dangers of allowing a goal are greatest and allows a bit more on periphery—a positive trade-off. Offensively, he focuses both his own personal attempts and the team’s attempts to that same key region of the ice. This is where we see the visual representation of why Sam’s expected goals for percentage is the highest on the team. This isn’t some made up number on a chart; this is shown by where he allows shots from on defense and where he creates them to be taken from on offense.
With the recent questioning of the status of the Sabres’ rebuild, I think we all wonder whether or not the members of the young core are progressing as they should be. In Reinhart’s case, I believe that he is.